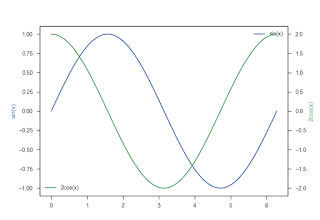
julia の PyPlot + seaborn で、2枚のグラフを並べる subplot() と、枠のスタイル sns.set_style() と、軸目盛の plt[:xticks]() の 例
julia の PyPlot + seaborn で、2枚のグラフを並べるの方法と、スタイルあれこれの例です。そのまま、コピー&ペーストして下さい。 (1) デフォルト darkgrid using PyCall, PyPlot @pyimport seaborn as sns x = linspace(0,2pi,100) sns.set() # デフォルト sns.set_style("darkgrid") と同じ subplot(211) ax1 = plot(x,sin.(x), label="sin(x)") ylabel("sin(x)", color=sns.color_palette()[1]) plt[:legend]() subplot(212) ax2 = plot(x,2cos.(x) , color=sns.color_palette()[2], label="2cos(x)") ylabel("2cos(x)", color=sns.color_palette()[2]) plt[:legend]() (2) ticks using PyCall, PyPlot @pyimport seaborn as sns x = linspace(0,2pi,100) sns.set_style("ticks") subplot(211) ax1 = plot(x,sin.(x), label="sin(x)") ylabel("sin(x)", color=sns.color_palette()[1]) plt[:legend]() subplot(212) ax2 = plot(x,2cos.(x) , color=sns.color_palette()[2], label="2cos(x)") ylabel("2cos(x)", color=sns.color_palette()[2]) plt[:legend]() (3) ticks + despine で、上と右の枠外し...